Guide
What AI Did to Software Gross Margins
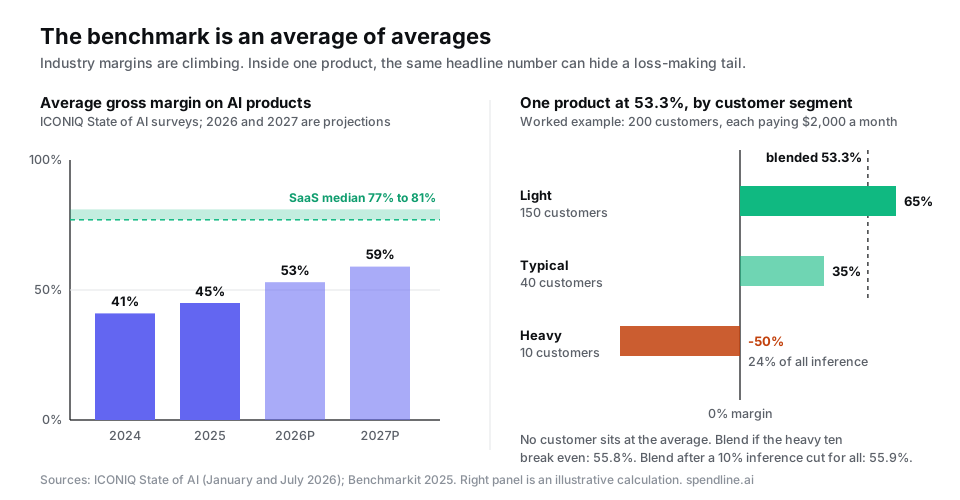
AI products run at a gross margin roughly 25 to 30 points below classic software. ICONIQ's July 2026 State of AI report, a survey of about 300 software executives, puts the average gross margin on AI products at 45% for 2025, with respondents projecting 53% for 2026 and 59% for 2027. Median SaaS gross margin is 77% on total revenue and 81% on subscription revenue, according to Benchmarkit's 2025 benchmarks.
The industry figure is rising by four to eight points a year. The number that decides your own margin is a different one: how unevenly your customers use the product while paying roughly the same price.
The numbers, and what they measure
| Source | What it measures | Figure |
|---|---|---|
| ICONIQ, January 2026 snapshot (N=269) | Average gross margin on AI products | 41% (2024), 45% (2025), 52% (2026 projected) |
| ICONIQ, July 2026 report (N=287) | Average gross margin on AI products | 45% (2025 actual), 53% (2026 projected), 59% (2027 projected) |
| ICONIQ, July 2026, by product type | 2027 projected gross margin | 67% infrastructure, 60% application layer, 48% consumer apps |
| Bessemer, State of AI 2025 | Fastest-growing AI startups vs steadier ones | About 25% vs about 60% |
| Benchmarkit, 2025 | Median SaaS gross margin | 77% total revenue, 81% subscription |
Three cautions before quoting any of this. ICONIQ measures margin on AI products at software companies, which includes companies that added AI to an existing product, not only AI-native ones. The 2026 and 2027 figures are what executives expect, not what they booked. And the 2026 figure moved from 52% to 53% between two editions published six months apart.
Why the company average misleads
A benchmark is an average of averages. Each respondent reports one number for their product, and that number is itself a blend of every customer they serve. Bessemer's State of AI 2025 shows how wide the spread is between companies: its fastest-growing cohort averaged about 25% gross margin while a steadier cohort sat near 60%. No survey reports the spread inside a single company, which is the one you can act on.
In classic SaaS, a customer who logs in ten times as often costs you almost nothing extra. In an AI product, every request buys inference, and an agent run buys many of them. Anthropic's engineers report that agents use about 4x the tokens of a chat and multi-agent systems about 15x. So the customer who turns on the agentic feature can cost several times what the customer next to them costs, on the same plan, at the same price.
The July ICONIQ report quotes a builder whose workflow was projected at $0.10 per run and reached $1.50 or more once agents retried and self-corrected. Token spend was the most common source of budget overruns in the survey. On one workflow that is a 15x gap between plan and reality, and a company-wide average absorbs it without showing it.
What moves the number
ICONIQ asked respondents which levers they rely on to improve AI margins. Ranked by how often each appeared in a top three: reducing inference costs, then routing strategies, then growing revenue for cost leverage, then switching to cheaper or open models, raising prices, and negotiating better provider pricing. Two-thirds reported that cost per query or per task fell over the past year. Eight percent said it got worse, and 3% said they do not track cost at that level at all.
In the January 2026 snapshot, talent fell from 32% of AI product costs before launch to 26% at scale, while model inference rose from 20% to 23%. Inference is the cost that grows with customers, so it is the one to measure per customer.
Consumption-based pricing rose from 35% to 42% of respondents in six months and outcome-based pricing from 18% to 23%. Among consumption-priced companies, 26% pass all inference cost through to customers, 58% share it and 15% absorb all of it. Passing cost through protects margin on heavy users, but only if you can tell which customers are heavy.
A worked example: 53% that is really three businesses
Take a product with 200 customers, each paying $2,000 a month, so $400,000 in monthly revenue. Assume non-inference cost of revenue (hosting, support, third-party services) of 20%, or $400 per customer. Inference varies by how each customer uses the product. The inference figures below are our illustration, chosen so the blend lands on ICONIQ's 2026 average.
| Segment | Customers | Inference per customer | Margin per customer | Segment gross profit |
|---|---|---|---|---|
| Light | 150 | $300 | 65% | $195,000 |
| Typical | 40 | $900 | 35% | $28,000 |
| Heavy | 10 | $2,600 | -50% | -$10,000 |
| Total | 200 | $107,000 total | 53.3% | $213,000 |
Gross margin is $213,000 on $400,000, or 53.3%, right on the survey average. Yet no customer is at 53%. Five percent of accounts consume 24% of inference ($26,000 of $107,000) and lose $1,000 a month each.
Now compare two fixes. Cutting inference cost 10% across every customer, through routing or caching, saves $10,700 and lifts margin to 55.9%. Bringing just the ten heavy accounts to break-even, by pricing their usage or capping it, recovers $10,000 and lifts margin to 55.8%. Ten conversations deliver nearly the same result as an engineering programme across the whole product. You can only choose between them if you can see the table above. If you cannot build that table for your own product today, a free 30-minute call will show you what it would take.
If you already record cost per call with a customer identifier, the distribution is one query. This assumes a monthly revenue table and a call ledger, both keyed by customer:
WITH cost AS (
  SELECT customer_id, SUM(cost_usd) AS ai_cost
  FROM ai_calls
  WHERE created_at >= '2026-08-01' AND created_at < '2026-09-01'
  GROUP BY customer_id
)
SELECT r.customer_id,
       r.revenue_usd,
       COALESCE(c.ai_cost, 0) AS ai_cost,
       ROUND(100 * (r.revenue_usd - r.other_cogs_usd - COALESCE(c.ai_cost, 0))
             / NULLIF(r.revenue_usd, 0), 1) AS margin_pct
FROM monthly_revenue r
LEFT JOIN cost c USING (customer_id)
WHERE r.month = '2026-08'
ORDER BY margin_pct ASC;
Sort ascending and read the top of the list. The full method, including which revenue figure to use and how to allocate cost with no customer attached, is in how to calculate AI gross margin by customer.
If you do not have that query yet, the free AI margin calculator gives a first estimate from six numbers you already know: customer count, price, the monthly AI bill, other cost of revenue, and how concentrated usage is in your heaviest accounts. It runs in your browser and nothing is sent anywhere.
Choosing a lever
The survey ranks what companies use. This table is our judgment of what each lever needs before it works.
| Lever | Moves | Needs per-customer cost data | Typical speed | Main risk |
|---|---|---|---|---|
| Model routing and caching | Cost, every customer | No | Weeks of engineering | Quality regressions on routed traffic |
| Switching to cheaper or open models | Cost, every customer | No | Weeks to months | Evaluation effort, output quality |
| Negotiating provider pricing | Cost, every customer | No | Depends on volume | Little leverage at small scale |
| Consumption or hybrid pricing | Revenue from heavy users | Yes | A pricing cycle | Customers resist unpredictable bills |
| Fixing negative-margin accounts | Both, a few customers | Yes | Days to weeks | Churning an account you wanted |
| Raising list prices | Revenue, every customer | No | A pricing cycle | Overcharges light users to cover heavy ones |
The four levers that need no customer data act on every account equally, including the light ones that were already profitable.
Where control and close come in
Once cost per customer is visible, two further steps become possible. Spend for a customer or workflow can be checked against a budget before the provider call is made, so a heavy account is capped or rerouted rather than discovered at month end (LLM budget enforcement). And the per-customer ledger can be reconciled against the provider invoice when the month closes, so the margin finance reports is a number rather than an estimate (the AI month-close process). Whether AI spend belongs in cost of revenue at all is its own decision, covered in AI COGS vs R&D.
Common failure modes
- Comparing your company average with a survey average. Both hide the spread that matters.
- Quoting ICONIQ's 2026 and 2027 figures as results; they are expectations.
- Dividing the provider bill by revenue and calling it margin. That produces the average customer, who does not exist.
- Raising prices for everyone to cover a few heavy accounts. Light users subsidise heavy ones and the best customers carry the cost.
- Measuring cost per request when the product runs agents. The run is the unit that varies, as covered in what an AI agent run actually costs.
- Not tracking cost per query or task at all, which 3% of ICONIQ's respondents admit to.
FAQ
What is the average gross margin for AI products in 2026? ICONIQ's July 2026 survey puts it at 53% projected for 2026, up from 45% actual in 2025 and 41% in 2024, with 59% projected for 2027.
How does that compare with traditional SaaS gross margins? Benchmarkit's 2025 median is 77% on total revenue and 81% on subscription revenue, about 25 to 30 points higher.
Why are AI gross margins lower than SaaS? Every request buys inference, and agent runs buy many requests. Inference takes a rising share of AI product costs as a product scales.
What actually improves AI gross margin? Respondents rank inference cost reduction, routing and revenue growth highest. In our judgment the fastest lever is often the few accounts running at negative margin.
Is a 53% AI gross margin good? It is the survey average, so on its own it says little. A 53% product can be mostly healthy customers plus a few deeply negative ones, so measure the spread before benchmarking.
Sources and method
Written from building and operating Spendline's AI spend governance proxy, with public primary sources checked on 29 September 2026: the 2025 to 2027 gross margin figures, product-type split, margin levers, per-query unit economics, pricing model shares, pass-through shares and the $0.10 to $1.50 workflow from ICONIQ's 2026 State of AI Report: The Builder's Economy (July 2026, survey of about 300 executives, May 2026); the 2024 figure and the cost composition by product stage from ICONIQ's 2026 State of AI Bi-Annual Snapshot (January 2026, survey December 2025); SaaS medians from Benchmarkit's 2025 SaaS Performance Metrics; cohort margins from Bessemer's State of AI 2025; token multiples from Anthropic's multi-agent engineering post. Survey figures are self-reported and partly projected. The worked example uses illustrative inputs of our own, and the lever table is our judgment. Last updated: September 2026.
Want to know which of your customers sit below zero? Book a free 30-minute call. No integration is needed: we go through where your AI cost lands by customer and workflow, and how you would find the accounts that cost more than they pay. If the call turns up a real gap, we offer a free 60-day pilot on your own traffic. Book the 30-minute call
Not ready to talk? Take the 5-minute assessment instead.